Worst-case test
How much volcano can the solar grid eat?
Tambora erupted in 1815 and the world had no solar grid to lose. It has one now — roughly 2.8 terawatts of it. If the same eruption landed in April 2027, how much breaks, for how long, and is the grid's real problem the volcano at all?
The short version
- Ash is local. Sulfur is global. Two very different failure modes that keep getting mixed up. Only sulfur reaches the stratosphere and stays there for years.
- Pinatubo (1991) is the only eruption we've actually measured. It cost the world roughly 1-6% of annual solar generation for about two years.
- Tambora (1815) is the worst one we've seen. Replayed today: 5-15% global solar loss for two to three years, Northern Hemisphere summers worst.
- Toba, 74,000 years ago, is the ceiling we haven't seen. 15-45% for years. At that scale, lost solar is not your grid's biggest problem.
If Tambora happens in 2027
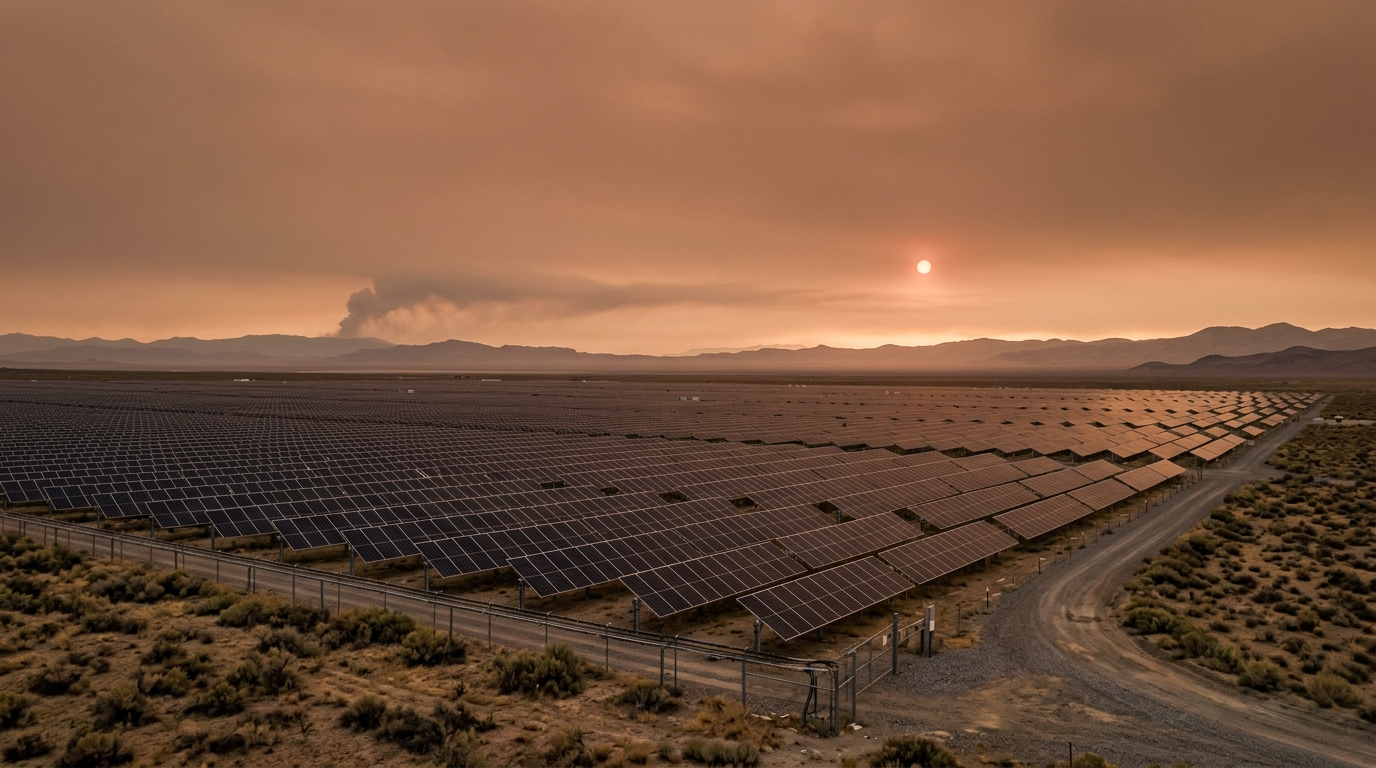
Pretend the 1815 Tambora eruption replays on 10 April 2027. Day one: a caldera the size of Singapore drops into the Indian Ocean. Week one: roughly 55 million tonnes of sulfur dioxide — the climate-active gas, which chemists write as SO₂ — reaches the stratosphere. Month three: the resulting sulfate veil has wrapped the globe. Year one: the clear-sky direct beam, meaning the sharp part of sunlight that hasn't been scattered, is 30-50% weaker at noon. Year two: a milky, cool, lower-contrast sky across most of the Northern Hemisphere summer.
The 1816 version of this caused frost in June in New England and crop failure in Yunnan, Bengal, and Ireland. The 2027 version would also cost roughly a tenth of the world's solar generation for two to three years. Not the same kind of damage. The same eruption, two different civilisations.
Volcanoes have a ceiling
The biggest thing the Earth can do is a volcanic explosivity index — VEI — of 8. That's a supereruption. Above that, size and frequency work so hard against each other that nothing bigger is in the geological record. Toba was a VEI 8, 74,000 years ago. That's the known ceiling.
What a volcano actually does
A big eruption does four different things. Only the stuff in the air reaches the whole planet.
On land
Ashfall, lahars (volcanic mudflows), pyroclastic flows (gas-and-rock avalanches that move at highway speed). Wrecks everything within a few hundred kilometres; buries things within a few thousand. For a grid operator a continent away, this is a supply-chain and transmission problem, not a generation problem.
At sea
Tsunamis from caldera collapse. Short-lived surface cooling. A small ocean acidification pulse when sulfuric acid rains down. Matters for coastal cities and fisheries. Barely for sunlight.
In the air
Ash and gas, injected high. Ash rains out in weeks. Tropospheric SO₂ rains out in weeks. But SO₂ in the stratosphere — above the altitude where weather happens — oxidises into sulfate droplets that scatter sunlight for years. This is the mechanism that reaches every panel and mirror on Earth.
The sky is the part that matters
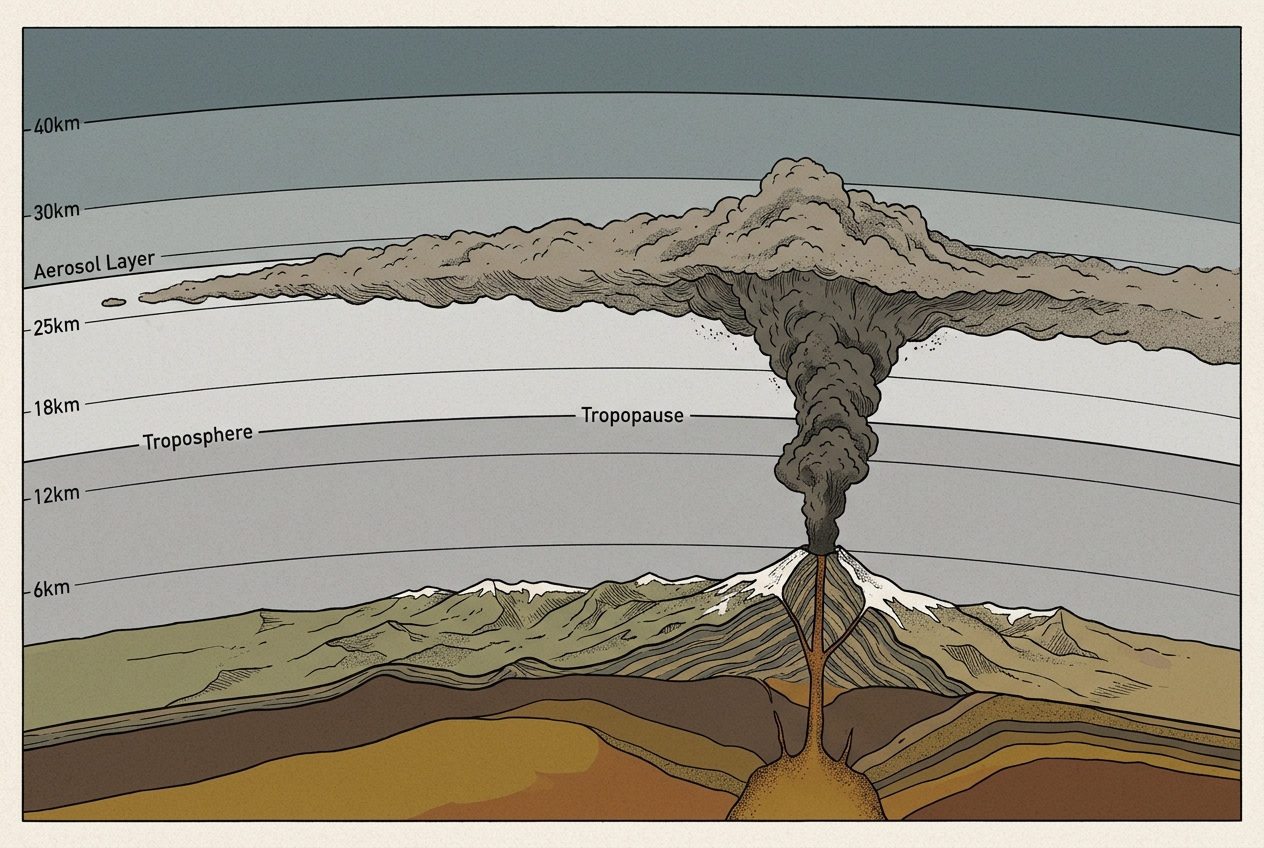
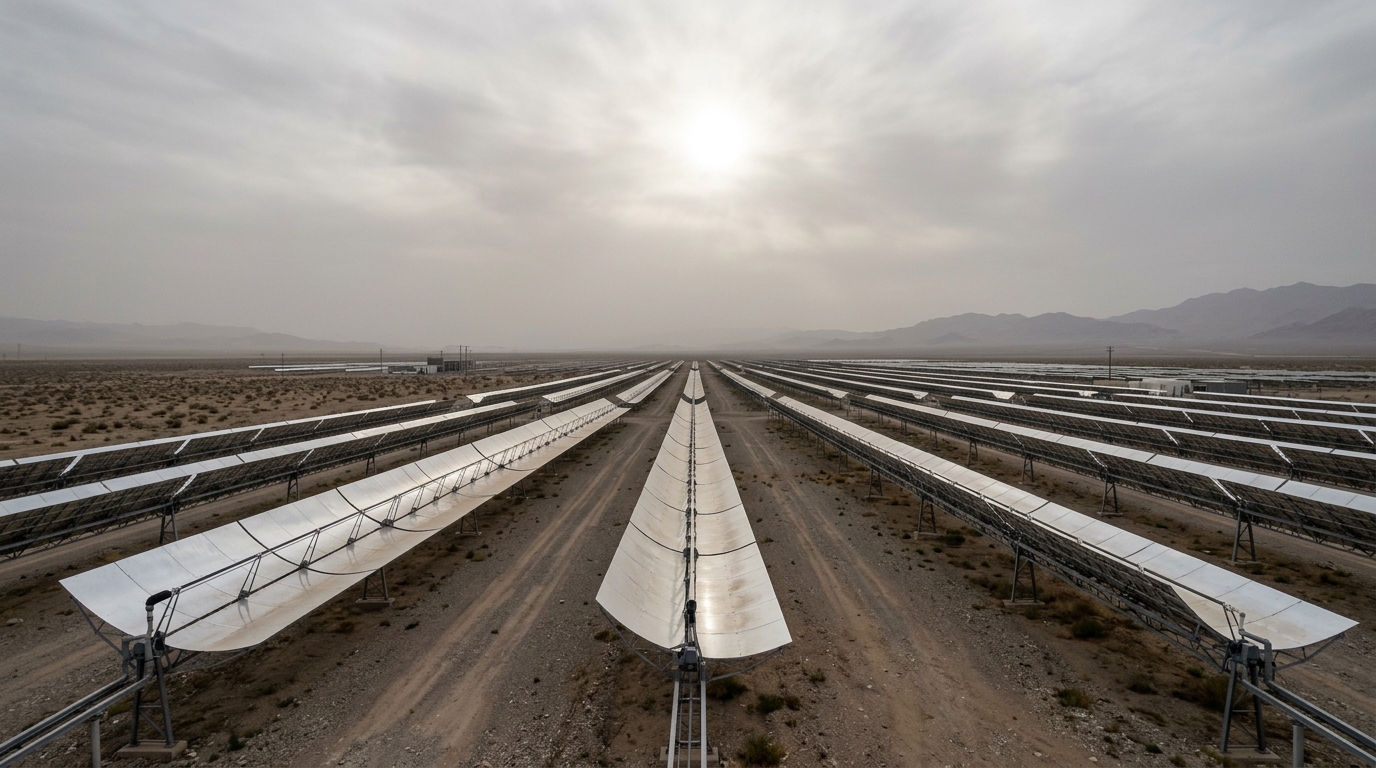
The scattered, bounced-around component of sunlight survives this mostly fine. The beam — the sharp, parallel-rays part that engineers call direct normal irradiance (DNI) — is what takes the hit. Sulfate particles scatter short wavelengths more strongly, which is why the sky goes milkier and pinker at sunset and lower-contrast blue at noon. For photovoltaic panels (PV) — the silicon kind on rooftops and utility farms — the loss is real but cushioned, because silicon happily eats diffuse light too. For concentrating solar power (CSP), the mirror-based kind where a parabolic trough or power tower focuses sunlight onto a heat-transfer fluid, there is nothing to cushion. Mirrors need a beam.
Three rings of damage
Global ring. The stratospheric sulfate veil. For one to three years after a big tropical VEI 6+ eruption, the beam is measurably weaker everywhere. PV loses a few percent of annual generation; CSP loses two to three times as much because its physics is beam-limited. A high-latitude fissure eruption like Iceland's 1783 Laki event skews the damage to one hemisphere instead of spreading it globally.
Running history through today's grid
The question a grid planner cares about is not "what happened." It's "what would that thing do now?" Line up the seven best-characterised large eruptions of the last few centuries against the 2026 solar fleet — about 2.8 terawatts installed, roughly three-quarters of it in the Northern Hemisphere.
Two things to take from the chart. First: even the "small" confident case — Krakatau — would cost a few percent of today's solar output for a year or two. Second: Laki looks modest because its damage was hemispheric, not global. Northern Europe in the 1780s felt it a lot more than the global bar suggests. A Laki replay would cost Scandinavia and the UK a lot more than it would cost Chile.
Four eruptions, four very different futures
A Tambora replay — survivable
5-15% annual global solar loss for roughly two years, Northern Hemisphere summers hit harder than the annual averages suggest. Grid planners already know how to absorb a multi-year capacity event: lean on transmission to move power from less-affected regions, extend storage duration, run firm capacity harder, feed satellite aerosol data into day-ahead solar forecasts. Painful. Expensive. Survivable.
Some volcanoes are just stinkier — Samalas (1257)
Samalas dumped about 158 million tonnes of SO₂ into the stratosphere — the largest sulfur pulse of the last 2,000 years. Tambora, with a larger eruption volume, only produced about a third as much sulfur. Nobody wants to play with Samalas. Replayed today: 6-16% annual global solar loss for two to four years, first year near the high end. This is the case that keeps grid planners up at night, because nothing in the instrumental record has reached it.
A Toba replay — off the chart
15-45% annual global solar loss, three to seven years, regional peaks above half. At this magnitude, solar is not the grid's primary problem and the grid is not the civilisation's primary problem. Ozone depletion, crop failure, and regional cooling dominate. The grid question stops being "how do we make up the solar?" and becomes "is there enough firm electricity capacity elsewhere to carry load while sunlight is rationed for three years?"
A Yellowstone-style mid-latitude VEI 8 — the asymmetric one
Mid-latitude injection doesn't mix globally as fast as a tropical one. The sulfate belt stays in the Northern Hemisphere for months before it crosses the equator. Because the Northern Hemisphere also holds about 75% of the world's PV, the damage gets geographically concentrated: 30-80% regional peak PV loss, 12-35% global annual, lopsided seasonality. Not physically the biggest case. Operationally one of the worst for a solar-heavy civilisation.
Beyond Toba
There probably isn't a meaningful "Toba × 10." Super-eruption frequency drops with size faster than magnitude grows. And particle-coarsening effects mean twice the SO₂ does not give you twice the optical depth — bigger aerosol particles scatter less efficiently per unit mass. The worst imaginable case is bounded by physics, not by imagination.
Sulfur, not size, is what dims the sky
If you had to pick one number to predict how much a given eruption will hurt global solar, you'd pick the mass of sulfur dioxide it injects into the stratosphere — not the VEI, not the crater size, not the fireworks. Here's what that looks like for the cast we've been tracking.
Three things worth staring at. First: St. Helens barely shows up, even though it was one of the most photographed eruptions in history. It didn't inject much sulfur. The global solar story is chemistry, not tonnage of rock. Second: Laki, at a fissure-eruption VEI of 4, punches far above its weight. Eight months of slow sulfur gas beats a few hours of fireworks. Third: uncertainty grows fast above Tambora. Toba's published estimates span two orders of magnitude — from 70 Tg (plausible) to 6,600 Tg (a volcanic winter). The scale of the damage is genuinely not known to within a factor of ten.
For reference, here's each scenario's numbers in one place:
| Eruption | VEI | Sulfur (Tg SO₂) | Sky haze (SAOD) | Global solar / yr | Peak beam loss | CSP / yr |
|---|---|---|---|---|---|---|
| St. Helens 1980 benchmark | 5 | <1 Tg SO₂ | 0.001-0.005 | 0-0.3% | 0-2% | 0-2% |
| Laki 1783-1784 analog | 4 | ~122 Tg SO₂ (most stayed in the lower atmosphere) | 0.03-0.1 | 1-4% | 10-30% | 8-25% |
| Krakatau 1883 analog | 6 | 14-23 Tg SO₂ (from optical-depth reconstruction) | 0.13-0.22 | 2-7% | 18-29% | 10-25% |
| Pinatubo 1991 benchmark | 6 | 15-20 Tg SO₂ | 0.12-0.19 | 1-6% | 17-25% | 8-22% |
| Samalas 1257 analog | 7 | 146-170 Tg SO₂ | 0.4-0.6 | 6-16% | 38-52% | 20-45% |
| Tambora 1815 analog | 7 | 53-58 Tg SO₂ | 0.25-0.45 | 5-15% | 32-50% | 18-45% |
| Toba ~74,000 years ago | 8 | 70-6,600 Tg SO₂ (central estimates ~200-500) | 0.5-1.5 | 15-45% | 55-90% | 40-85% |
| Yellowstone (hypothetical) synthetic scenario | 8 | 100-400 Tg SO₂ (speculative) | 0.4-1 | 12-35% | 45-80% | 30-70% |
SAOD is stratospheric aerosol optical depth — a dimensionless measure of sky haze. Clean sky is around 0.005. Pinatubo peaked at 0.15. Samalas was around 0.5. The numbers here are screening estimates: published sulfur and SAOD values pushed through a Beer-Lambert irradiance screen (beam loss ≈ 1 - exp(-SAOD / 0.65)) plus a correction for the diffuse-light cushion PV enjoys. A real grid study would replace the screen with radiative transfer, weather-year ensembles, fleet geometry, and dispatch modelling.
How to build for dim years
The mitigation list is the same regardless of which worst case you want to absorb. The dose is what changes.
- Aerosol-aware forecasting. Day-ahead and week-ahead solar forecasts that ingest satellite aerosol optical-depth products and volcanic plume tracking. Cheap, high-leverage, already prototyped.
- Transmission. A sulfate veil is never perfectly uniform. Moving power from less-affected regions to more-affected ones is the most valuable ton of infrastructure you can own in a volcano year.
- Storage duration, not just storage capacity. A four-hour battery arbitrages a normal day. A dim season needs days or weeks of firm energy — a completely different economics problem.
- Firm dispatchable capacity. Hydro, geothermal, nuclear, sustainable biomass, demand response. Keep enough of it in the fleet that a multi-year solar shortfall is absorbable without blackouts.
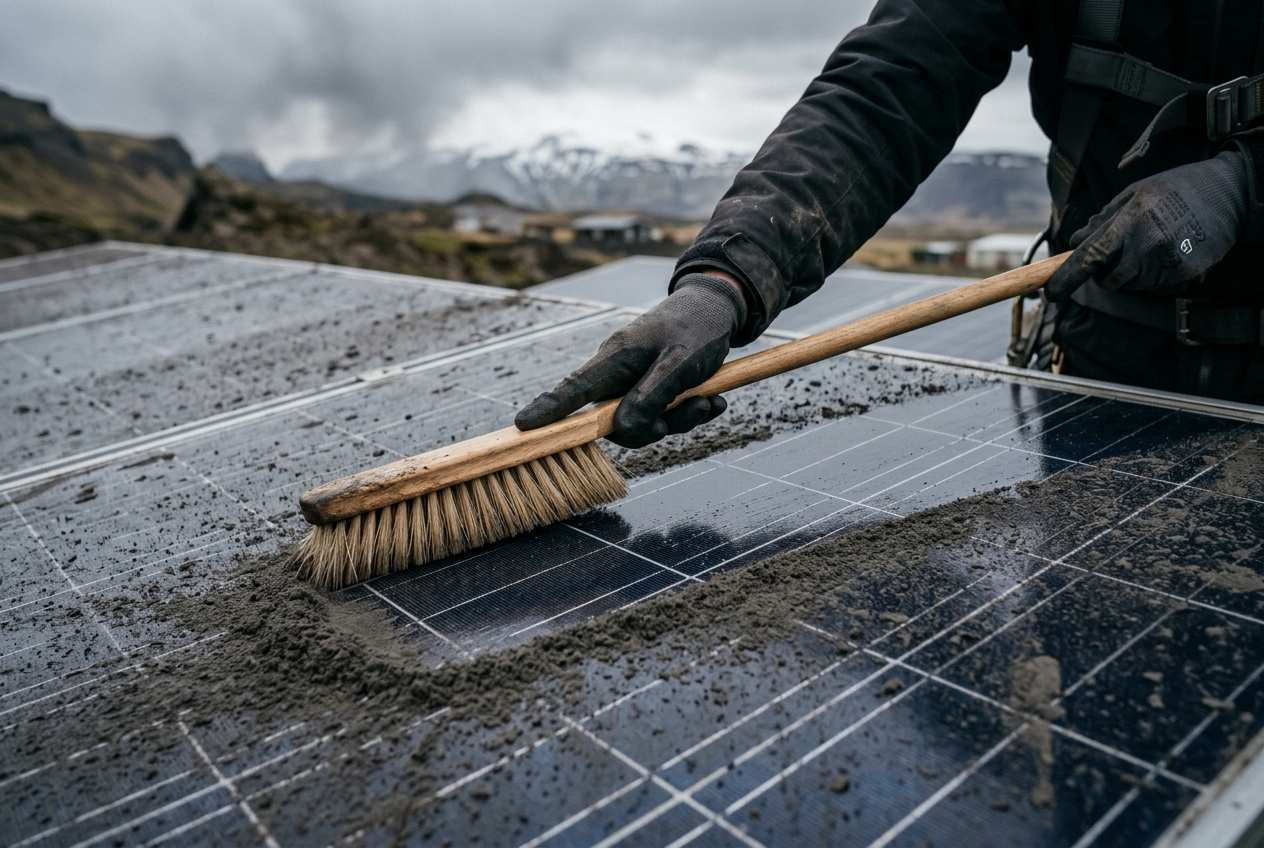
- Ash operations. Washing contracts, filter spares, inverter protection plans, drone survey capability, road-access agreements — anyone running solar within a few hundred kilometres of a Decade Volcano (one of the 16 large active volcanoes the international volcanology community has flagged as dangerous and close to people) needs these on file, not improvised at 3 a.m.
A VEI 7 is, best guess, a 1-in-1,000-year event. Small enough to ignore for an afternoon. Too big to ignore for a grid expected to run for forty years. A VEI 8 is a civilisational event, not an engineering one. Build for the first. Acknowledge the second.
Sources and caveats
These are estimates, not predictions. The modern-grid replay assumes today's installed-capacity map persists; real-world SO₂ injection, plume height, latitude, and season all swing the answer. The ranges are deliberately wide — this is aerosol physics plus grid reality, not a deterministic forecast.
- NASA Earth Observatory: Global Effects of Mount Pinatubo
- NASA Earth Observatory: Volcanoes and Climate Change
- NASA GISS: Stratospheric Aerosol Optical Thickness
- Molineaux and Ineichen, Solar Energy, 1996: Pinatubo direct/diffuse irradiance
- Lavigne et al. 2013 (PNAS): Samalas 1257 identified as source of 13th-century stratospheric veil
- Vidal et al. 2016 (Scientific Reports): Samalas 1257 single greatest stratospheric gas release of the Common Era
- Toohey and Sigl, eVolv2k: Volcanic stratospheric sulfur injections and SAOD 500 BCE-1900 CE
- Sigl et al. 2022 (ESSD): Holocene SAOD reconstruction from bipolar ice cores
- Smithsonian Global Volcanism Program: Tambora
- Smithsonian Global Volcanism Program: Krakatau
- Self et al. 2004: Tambora SO2 and sulfate aerosol estimate
- Thordarson and Self 2003: Laki atmospheric and environmental effects
- USGS: Mount St. Helens 1980 eruption impacts
- Brenna et al. 2020 (PNAS): Toba global climate disruption and regional climate shelters
- Osipov et al. 2021 (Communications Earth & Environment): Toba tropical stratospheric ozone depletion
- Marshall et al. 2024 (J. Climate): severe cooling after super-eruptions hinges on aerosol size
- IEA Renewables 2025: global solar PV capacity ~2.8 TW, growth outlook
- NREL/SAM PVWatts model: irradiance and temperature coefficient
- NREL: CSP and direct normal irradiance